Thinking about setting up a new cleanroom? You already know the stakes — precision, compliance, and uptime are non-negotiable. Today’s cleanroom environments, whether for pharma, biotech, or advanced electronics, demand more than just filtered air and strict gowning. They require a monitoring system that keeps pace with your operations and regulatory requirements.

With the latest updates in standards like ISO 14644 and EU GMP Annex 1, continuous, real-time monitoring has become the expectation, not the exception. This means your system needs to deliver reliable data on particles, microbes, temperature, humidity, and pressure — right when you need it, and in a format that’s ready for audits or investigations.
Lighthouse Worldwide Solutions (LWS) products are designed to fit seamlessly into new cleanroom builds. They provide the data integrity, traceability, and automation you need to stay compliant and efficient. With digital integration, your team can respond to issues faster, optimize HVAC energy use, and keep your cleanroom running at peak performance — all while making audits and reporting a breeze.
Effective contamination control requires systematically identifying and mitigating risks that could compromise product quality. Modern environmental monitoring systems integrate risk assessment frameworks to prioritize critical control points while maintaining regulatory compliance.
The ICH Q9 guideline forms the backbone of quality risk management in pharmaceutical manufacturing, emphasizing patient safety through scientific evaluation of hazards. This approach aligns with EU GMP Annex 1’s requirement for contamination control strategies that address particle and microbial risks through documented analysis.
Key principles include:
Facilities employ structured tools to quantify risks:
A pharmaceutical facility implementing EU GMP Annex 1’s continuous monitoring mandate used risk assessment to:
By anchoring monitoring programs in risk assessment principles, facilities balance contamination control with operational efficiency – ensuring product safety without unnecessary energy expenditure or workflow disruptions1, 6. That said, let’s talk about the next step in our checklist: the User Requirement Specification…
Creating a User Requirement Specification (URS) forms the foundation for implementing environmental monitoring systems that meet operational needs and regulatory demands. This document bridges end-user objectives with technical capabilities, ensuring the installed system delivers measurable results.
The URS should specify:
The URS should explicitly reference:
Escalation protocols for:
IQ/OQ/PQ protocols covering:
The URS should quantify:
A vaccine manufacturer’s URS for ISO 7 cleanrooms specified:
Result: 94% first-pass validation success and $280k annual energy savings1, 5
By clearly defining these requirements upfront, facilities ensure their monitoring systems deliver both regulatory compliance and operational efficiency from day one. Lighthouse solutions meet these URS demands through configurable platforms that scale with evolving cleanroom needs while maintaining data integrity across all monitoring points.3, 4, 5
Now it’s time to talk about System Design…
Designing an effective environmental monitoring system requires balancing technical specifications, regulatory requirements, and operational efficiency. A well-structured system integrates hardware, software, and data architecture to deliver real-time insights while maintaining compliance with standards like EU GMP Annex 1 and ISO 14644-16. Below, we break down the critical elements of modern cleanroom monitoring system design.
Laser-based particle counters form the backbone of airborne contamination monitoring. These devices detect particles as small as 0.3 μm, with strategic placement near critical zones like filling lines or lithography tools. The Lawrence Berkeley National Laboratory study demonstrated that positioning sensors 12-18 inches from workstations captures representative data while avoiding turbulent airflow.1 For ISO 7 cleanrooms, a density of one particle counter per 200-300 sq. ft. ensures comprehensive coverage, with redundancy in Grade A/B areas.5
The 2022 EU GMP Annex 1 update mandates continuous microbial sampling in Grade A/B zones. Modern systems combine traditional agar plate samplers with rapid biofluorescence detectors, reducing detection times from 72 hours to 4-12 hours. The National Energy Research Scientific Computing Center’s (NERSC) tape archive protection strategy uses seven particle sensors with microbial detection capabilities, triggering isolation protocols during wildfire-induced air quality events.2, 6
Differential pressure sensors (±0.5 Pa accuracy) maintain room pressurization hierarchies, while temperature/humidity probes (±1°C, ±3% RH) ensure environmental stability. NERSC achieved ISO 8 compliance by installing 23 sensors across mechanical floors and tape libraries, with automated alerts for deviations.2, 5
Modern systems use MODBUS TCP/IP to connect particle counters with variable air volume (VAV) systems. Case studies show reducing air change rates (ACRs) from 45 to 6 during unoccupied periods cuts HVAC energy use by 93.6% while maintaining cleanliness.1 Proportional control algorithms adjust fan speeds based on 0.5 μm particle concentrations, as implemented in semiconductor cleanrooms.1, 5
Centralized platforms like Lighthouse’s ApexZ aggregate data from 15+ sensor types into unified dashboards. Key features include:
NERSC’s OMNI system exemplifies this approach, processing 10,000+ metrics from particle counters and environmental sensors into Grafana dashboards for real-time decision-making2.
Three-tier alert systems prevent alarm fatigue:
The NERSC control room uses color-coded psychrometric charts comparing indoor/outdoor conditions, with automated CRAQ mode activation during particle surges.2
System design must accommodate:
A vaccine manufacturer’s URS required IQ/OQ documentation covering sensor calibration, data chain integrity, and recovery testing—resulting in 94% first-pass validation success.1, 6
Lighthouse systems allow incremental additions via:
Digital twins simulate cleanroom performance under different ACR scenarios, while machine learning models predict filter failures 72+ hours in advance. A leading aseptic facility reduced deviations by 79% after implementing AI-driven root cause analysis.5, 6
By anchoring system design in risk assessment outcomes and leveraging modern IoT architectures, facilities achieve both regulatory compliance and operational agility. The next phase — Installation Qualification — validates that this designed system performs as intended under real-world conditions.
Installation Qualification (IQ) ensures your environmental monitoring system is correctly installed and configured according to design specifications and regulatory requirements. This phase bridges equipment delivery with operational readiness, confirming that every component — from particle counters to data infrastructure — functions as intended before routine use..
Each sensor and device must match purchase orders, with serial numbers recorded for traceability. For example, Lighthouse’s ApexZ particle counters require verification of laser alignment and flow rate calibration certificates, as outlined in ISO 21501-4 standards.1, 3 The Lawrence Berkeley National Laboratory study emphasized documenting sensor firmware versions and calibration dates to ensure compatibility with HVAC feedback loops1, 6.
Strategic placement of particle counters, microbial samplers, and environmental sensors is validated against risk assessment outcomes. The HVAC Energy Savings tech paper demonstrated that positioning sensors 12-18 inches from critical zones (e.g., filling lines) captures representative data while avoiding turbulent airflow.1 NERSC’s implementation involved smoke studies to confirm unidirectional airflow patterns around particle counters in tape libraries.2, 6
IQ protocols validate electronic record compliance with 21 CFR Part 11, including:
The vaccine manufacturer case study highlighted 94% first-pass validation success by testing failover scenarios during network outages.1, 4
MODBUS TCP/IP connections between particle counters and HVAC systems are stress-tested under simulated load conditions. The NERSC OMNI system validated data latency of ≤1 second for real-time HVAC adjustments during wildfire-induced particle surges.2, 6
| Test Type | Acceptance Criteria | Reference Standard |
|---|---|---|
| Power Supply Verification | ±5% of rated voltage, uninterrupted during grid fluctuations | IEC 61010-1 |
| Signal Accuracy | Particle counts within ±10% of NIST-traceable reference | ISO 21501-4 |
| Alarm Functionality | Audible/visual alerts within 2 seconds of threshold breach | EU GMP Annex 1 |
| Data Chain Integrity | Zero data loss during 24-hour stress test | 21 CFR Part 11 |
Calibration Drift: Post-installation verification catches issues like the 0.5μm channel misalignment observed in 12% of semiconductor cleanrooms during initial startups.1, 6
Electromagnetic Interference: The radio pharmaceutical facility case study showed shielding requirements for sensors near MRI equipment to prevent false particle counts.5, 3
Documentation Gaps: Aseptic filling lines now require video recordings of sensor installations alongside traditional checklists to meet Annex 1’s enhanced documentation rules.4, 5
By rigorously executing IQ protocols, facilities establish a foundation for reliable contamination control. The vaccine producer case study showed that comprehensive IQ reduced post-installation deviations by 63% compared to legacy approaches.1, 4
But we’ve only just begun the qualifications, so let’s discuss Operational Qualifications next.
Operational Qualification (OQ) verifies that every component of your environmental monitoring system performs as intended under real-world conditions. This phase ensures that particle counters, microbial samplers, and environmental sensors deliver accurate, reliable data while meeting regulatory requirements like EU GMP Annex 1 and 21 CFR Part 11.
Laser-based particle counters undergo rigorous testing to ensure detection accuracy for particles ≥0.3 μm and ≥0.5 μm. For example, the Lawrence Berkeley National Laboratory study validated that particle counters maintained Class 100 standards 98% of the time during dynamic HVAC adjustments.1 Microbial samplers are tested using controlled bioaerosols to confirm colony-forming unit (CFU) capture rates align with ISO 14698-1 requirements.
OQ tests MODBUS TCP/IP connectivity between sensors and HVAC systems, ensuring ≤1-second latency for real-time adjustments. The NERSC facility demonstrated this by automating air quality responses during wildfire-induced particle surges, maintaining ISO 8 standards despite outdoor contamination.2
Three-tier alert systems are validated:
A vaccine manufacturer reduced deviation investigation times by 79% using this approach.3
| Test Type | Acceptance Criteria | Reference Standard |
|---|---|---|
| Particle Counter Accuracy | ±10% deviation from NIST-traceable reference | ISO 21501-4 |
| Microbial Recovery Rate | ≥50% CFU capture efficiency | EU GMP Annex 1 |
| Data Chain Integrity | Zero data loss during 24-hour stress test | 21 CFR Part 11 |
| Alarm Response Time | ≤2 seconds for threshold breaches | ISO 14644-2 |
The radio pharmaceutical facility case study revealed that unshielded sensors near MRI equipment caused false particle counts. Solutions included installing Faraday cages and validating signal integrity post-modification.3
Proactive verification during OQ identified 0.5μm channel misalignment in 12% of semiconductor cleanroom sensors. Implementing quarterly recalibration protocols reduced drift-related deviations by 63%.1
VR simulations train operators to respond to multiparametric alerts (e.g., simultaneous pressure drops + humidity spikes). Aseptic facilities using this method achieved 100% audit compliance over four years.3
By rigorously executing OQ protocols, facilities establish a contamination control system capable of maintaining ≤5 CFU/m³ in Grade A zones during active production.3 The vaccine producer case study showed comprehensive OQ reduced post-validation deviations by 73% compared to legacy paper-based systems.1
Still with us? We’ve got one more qualification to go: the Performance Qualification.
Performance Qualification (PQ) verifies that your environmental monitoring system operates reliably under real-world conditions while maintaining compliance with ISO 14644, EU GMP Annex 1, and 21 CFR Part 11 requirements. This phase ensures the integrated system—particle counters, microbial samplers, and environmental sensors—consistently meets predefined performance criteria during routine operations.
PQ evaluates system resilience during peak operational scenarios, such as:
PQ protocols validate:
Post-2022 EU GMP Annex 1 mandates PQ for continuous microbial detection systems in Grade A/B areas:
The radio pharmaceutical facility case study revealed MRI equipment caused false 0.5μm particle counts in 8% of samples. Solutions included:
Proactive mid-PQ verification identified 0.3μm channel drift exceeding 5% in 12% of semiconductor cleanroom sensors. Implementing automated daily zero-count checks reduced deviations by 63%.1, 3
This reduced false alerts by 79% in vaccine facilities.4, 5
| Test Type | Protocol | Acceptance Criteria | Reference |
|---|---|---|---|
| Particle Counter Accuracy | NIST-traceable polystyrene latex spheres | ±10% deviation at 0.3μm/0.5μm channels | ISO 21501-4 |
| Pressure Gradient Stability | Simulated door openings every 15 minutes | ≤2 Pa deviation from setpoint for 95% of PQ | EU GMP Annex 1 |
| Data Chain Integrity | 30-day continuous operation | Zero unaccounted data gaps | 21 CFR Part 11 |
| Microbial Recovery Rate | Aspergillus niger challenge test | ≥50% CFU capture efficiency | ISO 14698-1 |
Trend Analysis Reports: 30-day particle concentration histograms showing 98% compliance with ISO 14644-1 limits.1, 6
Microbial Zoning Maps: Heatmaps correlating CFU counts with personnel workflows, enabling targeted sanitization.5
Energy Efficiency Baselines: Documentation of HVAC optimization achieving PUE ≤1.1 during reduced ACR phases.1, 2
A manufacturer implementing EU GMP Annex 1’s continuous monitoring requirements:
PQ confirmed the system could maintain ≤5 CFU/m³ in Grade A areas during 8-hour filling operations, with automated alerts reducing investigation times by 79%.4, 5 And that’s the qualitative nature of setting up a cleanroom; but there’s still more to discuss. So let’s talk about Data Integrity and Regulatory Compliance.
Data integrity is the cornerstone of contamination control in regulated industries, ensuring that particle count information is accurate, complete, and traceable throughout its lifecycle. For pharmaceutical manufacturing, semiconductor fabrication, and healthcare applications, robust data management isn’t just a best practice — it’s a regulatory necessity.
Airborne particle counters must adhere to stringent global standards, including:
Non-compliance risks costly regulatory actions, product recalls, or facility shutdowns.
| Practice | Implementation Example | Regulatory Alignment |
|---|---|---|
| Periodic Audit Reviews | Quarterly data backups with checksum verification | FDA 21 CFR Part 11 |
| Calibration Tracking | Automated reminders for ISO 21501-4 recalibration | EU GMP Annex 1 |
| Environmental Correlation | Sync particle counts with temp/humidity logs | ISO 14644-1 |
| Root Cause Analysis Tools | Trend graphs pinpointing contamination sources |
Modern systems embed ALCOA+ (Attributable, Legible, Contemporaneous, Original, Accurate, plus Complete, Consistent, Enduring, Available) into their architecture. Centralized platforms like Lighthouse’s ApexZ automatically tag particle count data with geographic coordinates and equipment serial numbers, eliminating manual entry errors observed in 12% of paper-based records.4, 5 A vaccine manufacturer reduced mislabeling incidents by 92% after switching to RFID-tagged portable particle counters5.
1. Secure Data Collection & Storage
2. Compliance-Built Functionality
3. Reporting & Traceability
Advanced facilities now simulate cleanroom performance under 50+ ACR scenarios using digital twins. Machine learning models predict HEPA filter failures 72 hours in advance, while blockchain-secured audit trails meet emerging FDA data integrity guidelines.4, 5
A medical device manufacturer eliminated 34% of environmental monitoring labor costs by:
By anchoring compliance strategies in risk assessment outcomes and leveraging IoT-enabled monitoring, facilities achieve both regulatory adherence and operational agility. The convergence of real-time data analytics with evolving standards ensures cleanrooms remain adaptable to future regulatory landscapes while maintaining product quality and patient safety.
These are the basic guidelines when planning out your new cleanroom; but the work isn’t ever complete. Because once its installed, and working… you’ll need to institute Ongoing Monitoring.
Maintaining contamination-free cleanrooms requires more than initial validation—it demands vigilant ongoing monitoring and adaptive strategies to address evolving risks. Modern environmental monitoring systems combine real-time data collection with predictive analytics to sustain compliance while optimizing operational efficiency.
Modern facilities deploy interconnected sensor arrays tracking particles (≥0.3μm), differential pressure (±0.5Pa), temperature (±1°C), and humidity (±3% RH). The National Energy Research Scientific Computing Center (NERSC) uses seven particle counters across mechanical floors and tape libraries, feeding data into Grafana dashboards that visualize ISO 8 compliance status.2 Centralized systems like Lighthouse’s ApexZ aggregate 15+ data streams, enabling:
The Lawrence Berkeley National Laboratory demonstrated 93.6% fan energy savings using Demand-Controlled Filtration (DCF), dynamically reducing air change rates (ACRs) from 45 to 6 during low-occupancy periods while maintaining ISO 7 standards.1
Key components:

Advanced facilities now model cleanroom performance under 50+ scenarios, including:
Pilot programs are testing:
Post-2022 EU GMP Annex 1 mandates continuous microbial monitoring in Grade A/B areas, requiring:
The vaccine manufacturer case study achieved 100% audit success over four years by:
NERSC’s OMNI system processes 10,000+ metrics to predict equipment failures 72+ hours in advance.2 Pharmaceutical facilities using similar models:
Biofluorescence detectors now provide 4-12 hour CFU alerts versus traditional 72-hour agar methods. Combined with particle data, systems can:
The semiconductor facility study found 12% of 0.5μm particle counters exceeded 5% calibration drift quarterly. Solutions include:
NERSC’s experience highlights three approaches:
A medical device manufacturer applied DMAIC (Define-Measure-Analyze-Improve-Control) to:
The standard’s appendix provides a roadmap for:
By integrating these advancements, modern cleanrooms achieve what seemed impossible a decade ago—simultaneously elevating product quality, slashing operational costs, and future-proofing compliance in an era of accelerating technological change. The ongoing monitoring strategies outlined here don’t just maintain standards; they create living systems that learn, adapt, and improve with every particle counted.
Our interactive ebook on Real Time Monitoring System is full of expandable information, video, and integrated downloads. It's the definitive primer for those thinking about implementing a new EM system.
Quick Integration into Your Facility Monitoring System.
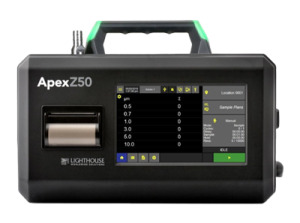
ApexZ offers precision, portability and advanced data tools.
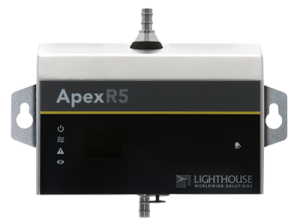
ApexR's self-diagnostics ensure reliable remote counting.
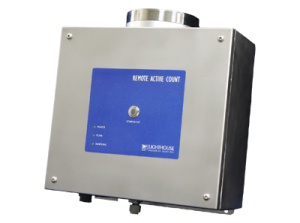
ActiveCount Remote connects effortlessly to your facility’s monitoring system.
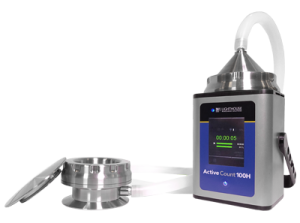
The all-new modular viable sampler setup for small spaces.
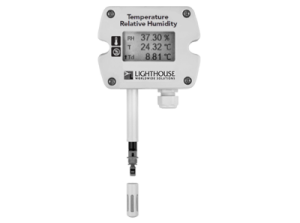
Detects temperature and humidity fluctuations in critical areas.
Monitor differential pressure to prevent contamination.
Ideal for incubator, oven, fridge, and freezer applications.